New Paper : Beyond the Walled Garden - a visual essay at IEEE VIS

A visual essay in 5 chapters by Jo Wood.

"Data visualization was tended in a walled garden.”

Yet there was land beyond the trees..."

https://altvis.github.io/#walled-garden

https://vimeo.com/760406142

AI image generation from language prompts has advanced rapidly in little over a year.

It is about to change the way we design data visualization.

This picture essay considers some of the possibilities and the trade-off between the new expressiveness it provides us with and the potential loss of effectiveness that comes with learning new and more complex graphical languages.

It questions whether traditional notions of locatable objects and retinal variables are still applicable in this more sophisticated graphical environment.

New Paper : Me-ifestos - Empowerment for Teaching & Learning?

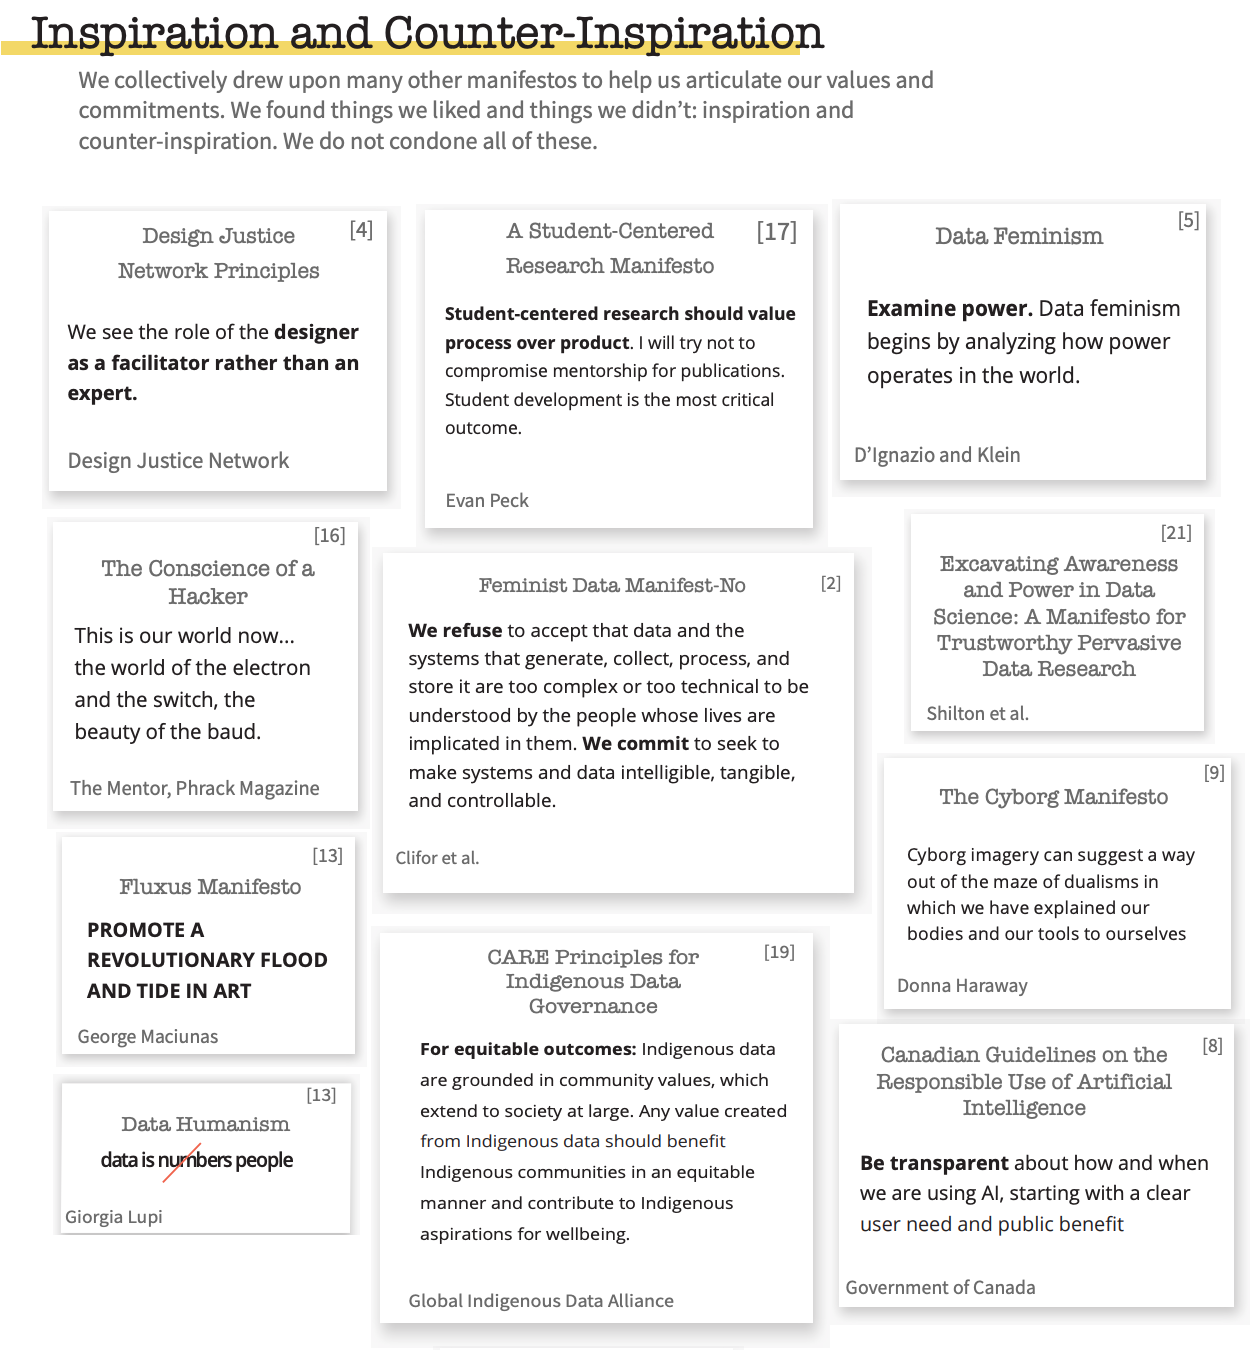
Jason Dykes was one of a number of contributors to the alt.vis workshop paper on re-imagining manifestos as statements of personal intent for visualization teaching and learning.

In Me-ifestos for Visualization Empowerment in Teaching (and Learning?) a diverse group of visualization teachers are inspired by existing manifestos to share and develop perspectives on visualization education, and surprised by how empowering this process is.

The paper includes examples for inspiration and counter-inspiration, value statements and a process through which visualization teachers can develop their own personal manifestos - or ‘me-ifestos’ - as the manifesto is reclaimed to empower the individual.

Presented at IEEE VIS in Oklahoma City, the paper is full of questions as the authors try to work out how personal manifestos might be used beneficially to empower teachers and learners.

New Paper: Visualization and Epidemiological Modelling (PTRSA)

Radu, Aidan, Jo and Jason are members of a team of 33 visualization researchers and epidemiologists who have just published a paper in the Philosophical Transactions of the Royal Society A - the World’s first scientific journal which has, over the years, featured Halley, Newton, Darwin and other A-listers of science (!)

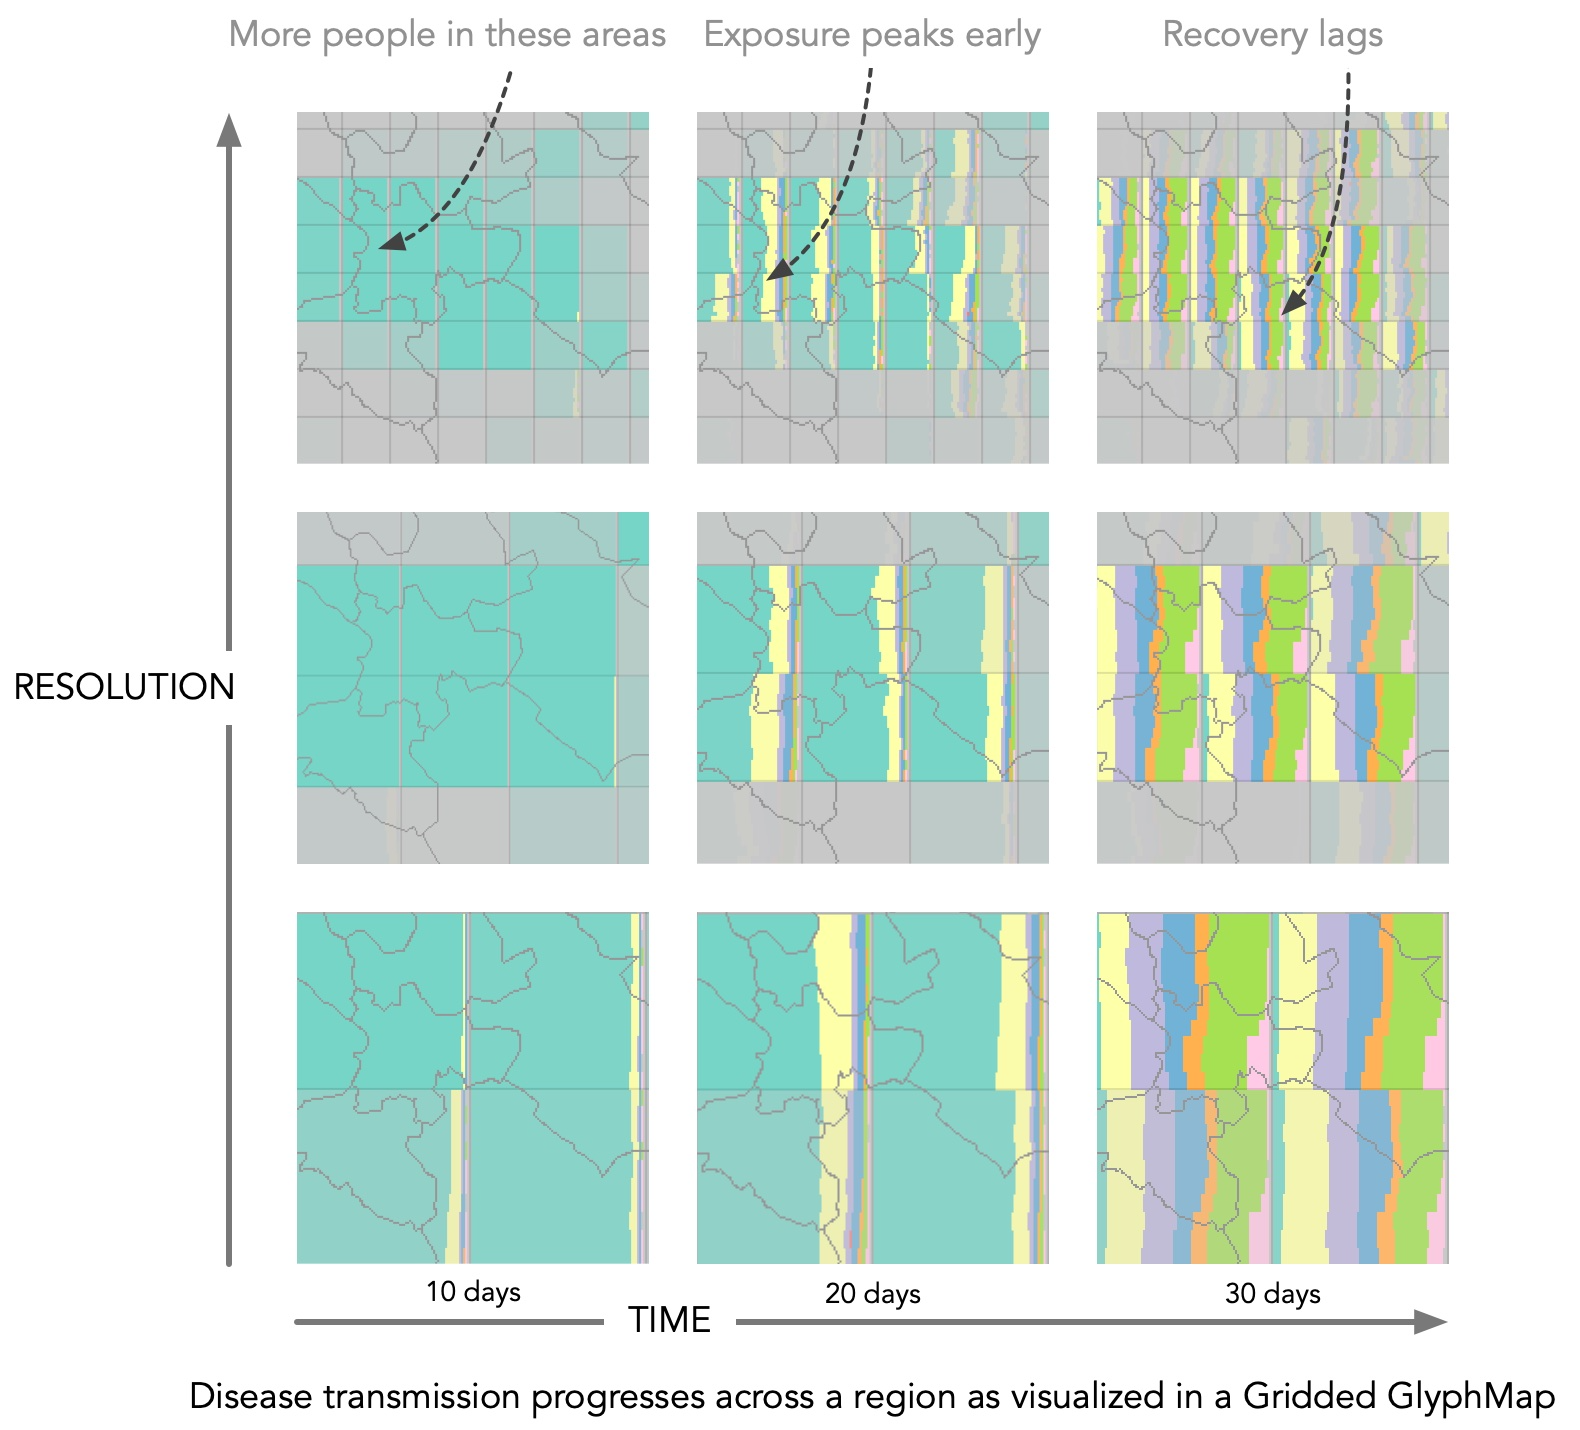
Visualization for epidemiological modelling: challenges, solutions, reflections and recommendations is based upon their experiences of trying to understand models and predict disease transmission and progression during the COVID 19 pandemic in the UK.

It draws conclusions about the use of visualization to support modelling at various stages of the process and includes many examples of novel and effective visualization interventions.

The paper is available through Open Access and provides a rich supplement of interactive materials and evidence that support the claims. This news item from City, University of London summarises things nicely.

Le Tour de VIS 2021 - Virtual

The post IEEE VIS bike ride - Le Tour de VIS - remained virtual and distributed for 2021.

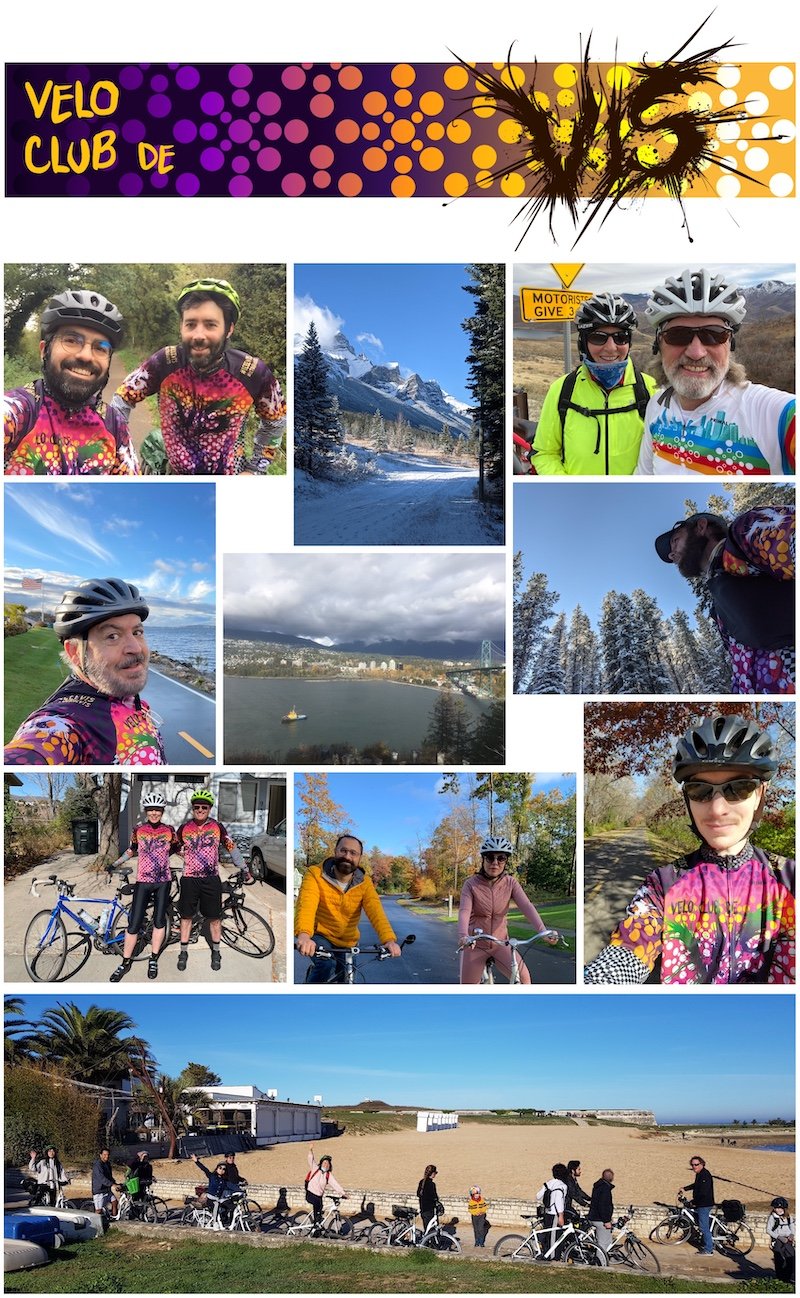
But this didn’t stop people getting on their bikes!

Aidan and Cagatay rode in Warwickshire, Jason rode in Leicester and others rode in Canada, France, Italy, Utah, New Mexico, Rhode Island, Massachusetts, Minnesota, Watopia and various other places (real and otherwise).

Check @veloClubDeVIS and #LeTourDeVIS for details, ride reports and pictures!

Stay fit, ride safe!

IEEE VIS - Certificate of Appreciation

Jason Dykes has received a Certificate of Appreciation for Outstanding Service to the VIS conference from the IEEE Computer Society.

After 10 years service as Papers Chair for IEEE Information Visualization (2012-13), on the IEEE VIS Steering Committee (2014-19), and on the IEEE VIS Executive Committee (2017-21), Jason’s various terms finally ended at IEEE VIS 2021, New Orleans. 

It has been a busy decade for the conference - with open practice recommendations, diversity scholarships, elections, a code of conduct, short papers, live streaming, satellite events and an annual bike ride all being established.

A new governance model, the Test of Time awards, the integration of the three contributory conferences (InfoVis, VAST and SciVis) into a new set of data driven subject areas and the conference location venturing beyond North America and Europe are also initiatives to which Jason has contributed.

And the pandemic was quite a challenge too. But the conference ran virtually in 2020 and 2021 and this has opened up new ways of engaging in and contributing to VIS. Many of these will persist.

Next year, IEEE VIS will be held in Oklahoma City, OK as a hybrid conference. 

IEEE VIS - Words of Estimative Correlation

Rafael Henkin and Cagatay Turkay presented their paper on the terms used to describe correlation in scatter plots, and the scatter plots people select in association with particular terms. at IEEE VIS in New Orleans.

‘Words of Estimative Correlation: Studying Verbalizations of Scatterplots’ is a really nice extension of some of the ideas about the terms that people use to describe probabilities:

  • highly likely, probable, good chance, likely

The paper is published in IEEE Transactions on Visualization and Computer Graphics with a pre-print available on arXiv.

You can watch Rafael present the work at IEEE VIS on YouTube.