
Small Multiples with Gaps
We published a paper entitled “Small Multiples with Gaps” in IEEE Transactions on Visualization and Computer Graphics.
The core idea, also explained in the video, is that we often want to compare similar data according to different conditions. For example, compare data across years, companies, countries, etc. Small multiples are a prominent technique to achieve this, where the data for each condition (each year, company, country, …) is visualized separately but in the same way. By showing these small graphics side by side, we can compare and look for effects and trends.
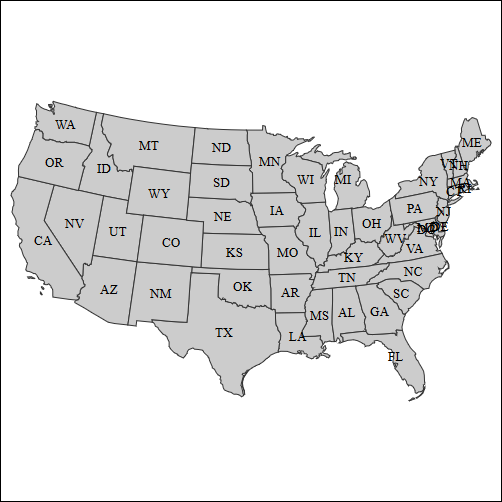
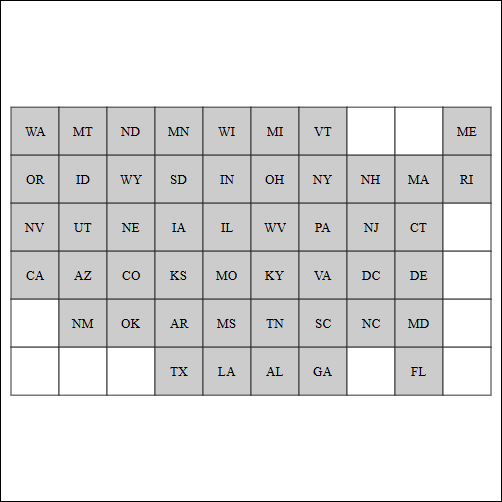
In general, but in particular when dealing with a spatial condition (e.g. by country or by province), the arrangement of these small graphics can carry further information such as the spatial distribution. Introducing gaps in the arrangement intuitively allows us to more clearly show some spatial aspects. In this paper, we formalize and investigate the effect of such gaps.

The paper and additional material can be found as a featured paper on the giCentre website.