
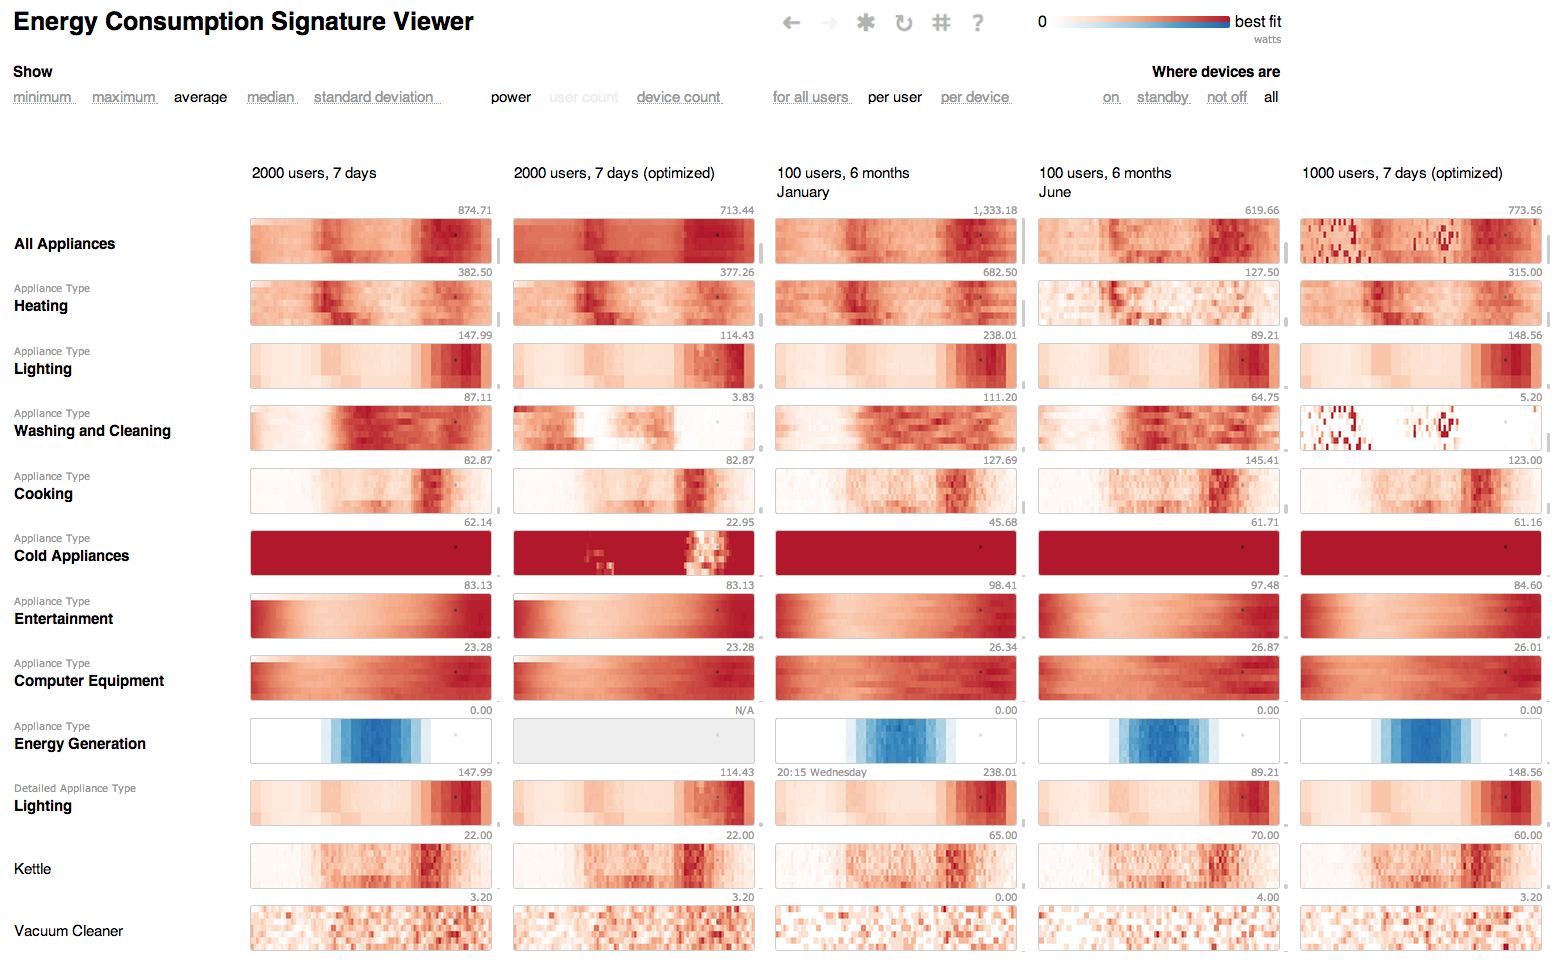
Consumption Signatures - interactive comparable calendars showing energy consumption by device and device type for modelled data.
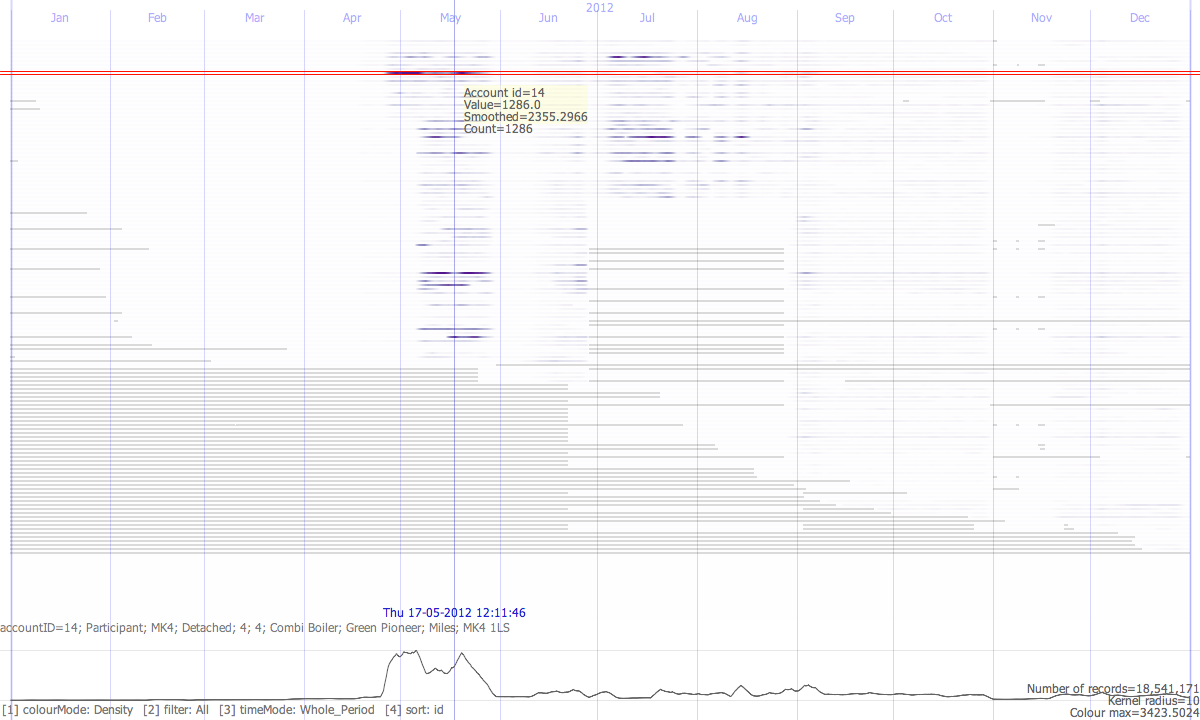
HeatLines - interactive visualization of smart meter readings over time per household shows overall level of recording during the SmartHome trial.

HorizEon - interactive visualization of daily appliance usage allows analysts to interactively model increases in efficiency or changes in daily consumption patterns to see overall effects on energy usage.
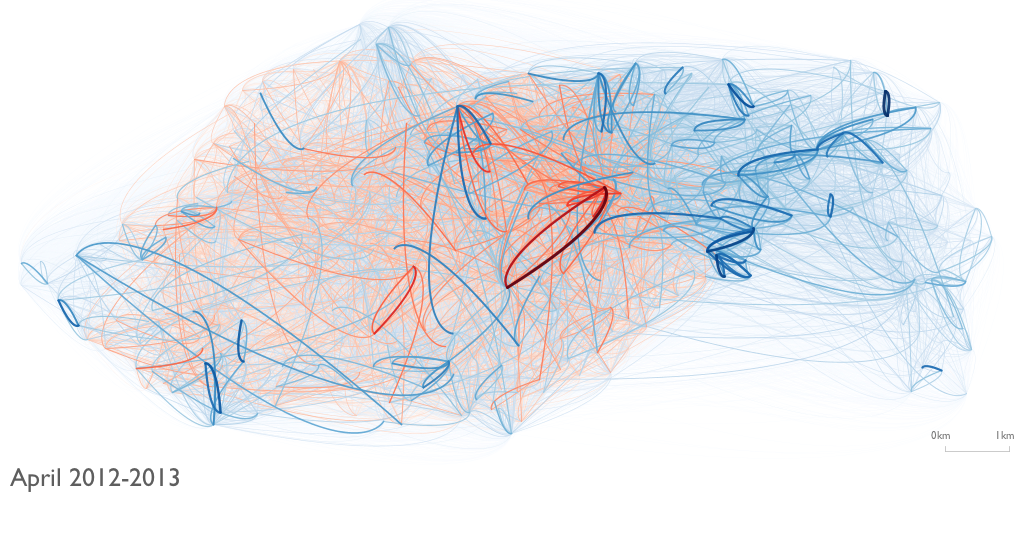
London Cycle Scheme - journeys between station pairs emphasizing the year April2012-April2013 (blue) over April2011-April2012 (red).

London Cycle Scheme - analysing spatial and temporal patterns in journeys between station pairs concurrently with visual analytics.
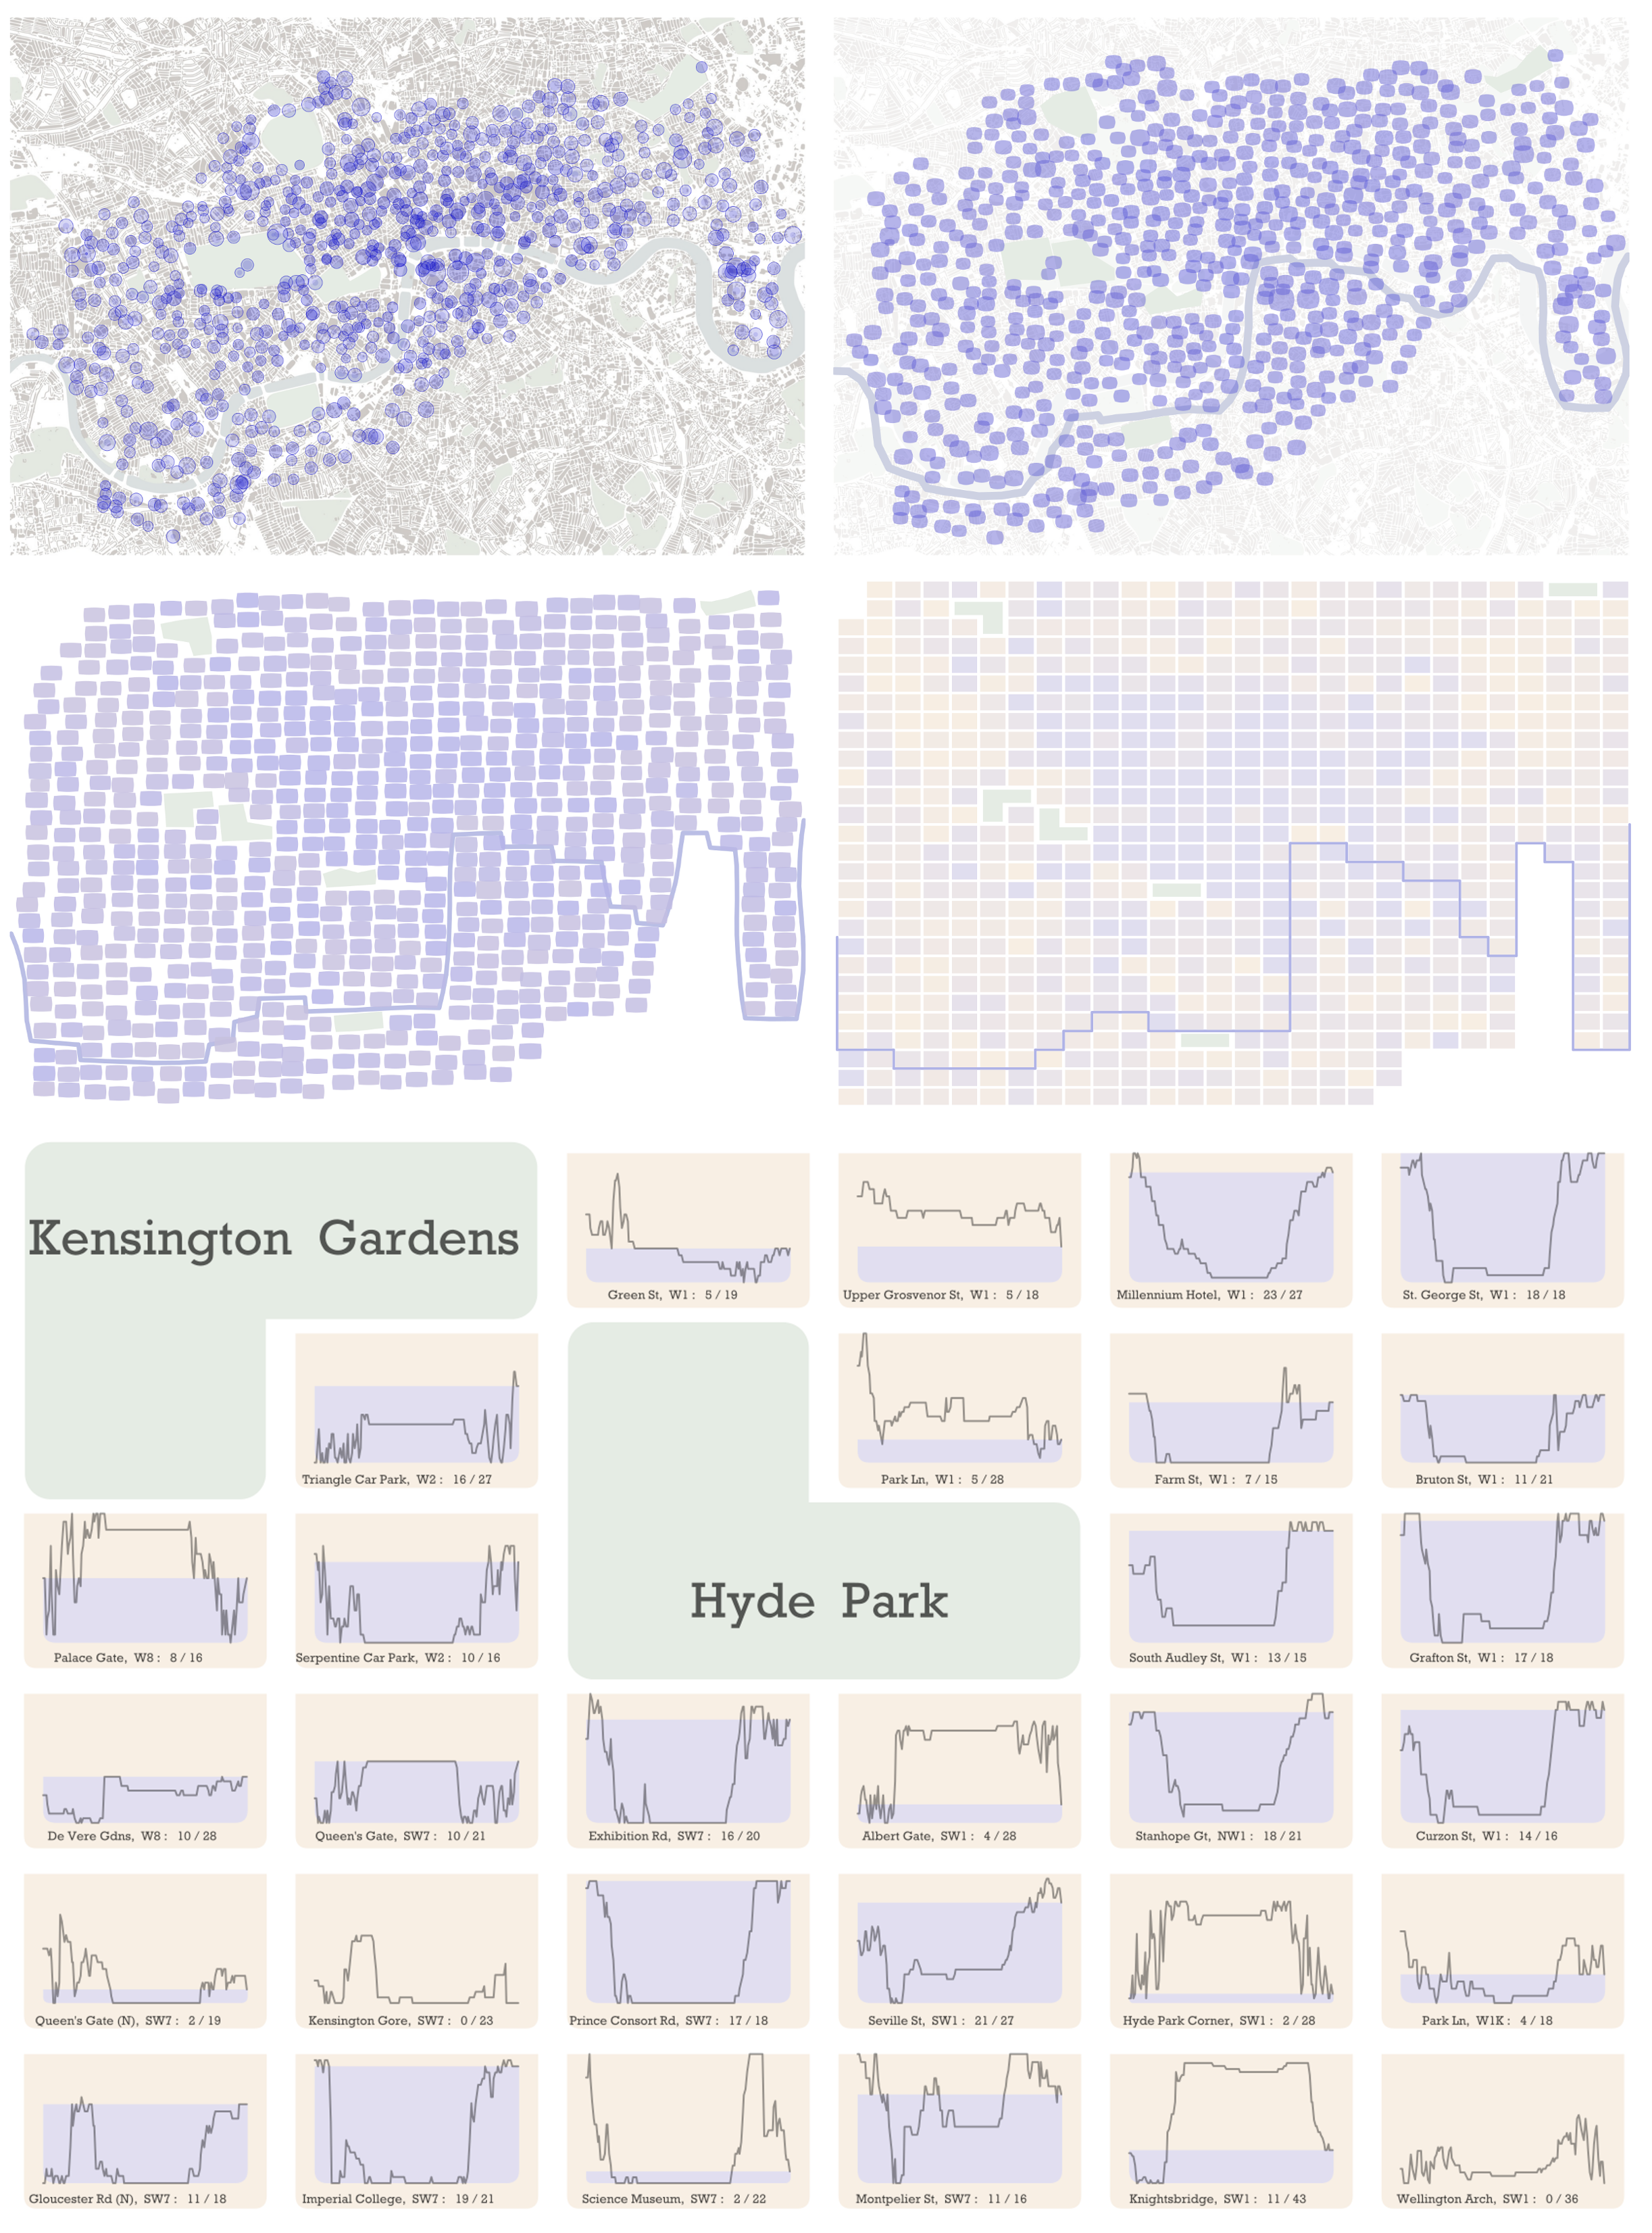
London Cycle Scheme - BikeGrid looks at the performance of all stations over 24 hours concurrently.

London Cycle Scheme - analysis of workplace.