LINKöPING GUIDELINE DEMO HACK >>
1 - 3 - 25
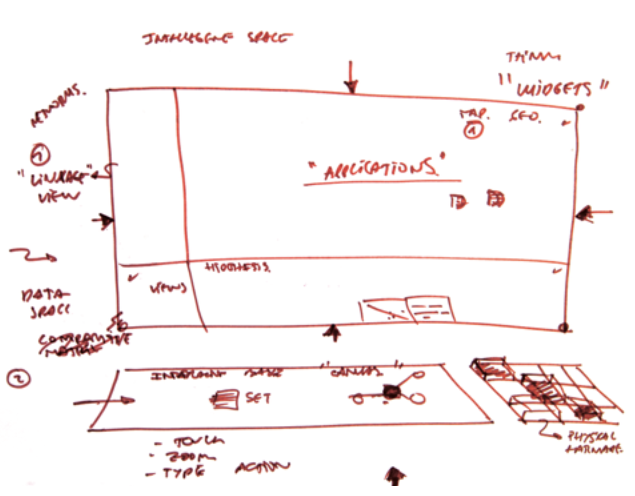
>> Visual Encoding
- Position, size, and colour variations always have meaning in every view - e.g. >> Munzner (2014)
- Move things to counter occlusion - e.g. >> BikeGrid (Wood et al, 2010); >> LondonSquaredMap (AfterTheFlood, 2014)
>> Control
- The data is the interface - e.g. >> PivotPaths (Doerk et al, 2012); >> PlaceSurvey (Slingsby et al, 2014); >> SketchStory (Lee et al, 2013)
- Controls appear only when you need them and in context - e.g. >> Bertifier (Perin et al, 2014)
- Need is determined by location (cursor | eye | data)
- Always have a description of configuration in natural language - e.g. PlaceSurvey (Slingsby et al, 2014); >> Glo-STIX (Stolper et al, 2014)
- Physical objects and data may interact in interesting and useful ways - e.g. VeniceUnfolding (Nagel et al., 2010)
>> Cross-View Interaction
- Moving containers (view and token) to different places has effect - e.g. >> LiquiData (Nagel et al., 2011)
- Data can be selected and transferred from one widget into another - e.g. >> OnSet (Sadana et al, 2014).
>> Process
- Start with "what's new"? - e.g. PivotPaths (Doerk et al, 2012)
- Keep your eyes on the data - e.g. Tangible Remote Controllers (Jansen et al., 2012)
- Workflows can be saved as a template in order to be applied to other data - e.g. DIVA (Walker et al., 2013); Glo-STIX (Stolper et al, 2014)
>> Things We Don't Say ...
... deliberately in some cases ...
- How to Achieve Consistency
- Interactions & Conflicts
- Anything Specific
- How we expect you lot to contribute | react to this
- Various Other Stuff ...