The giCentre is a research group in the Dept of Computer Science at City, University of London, UK.
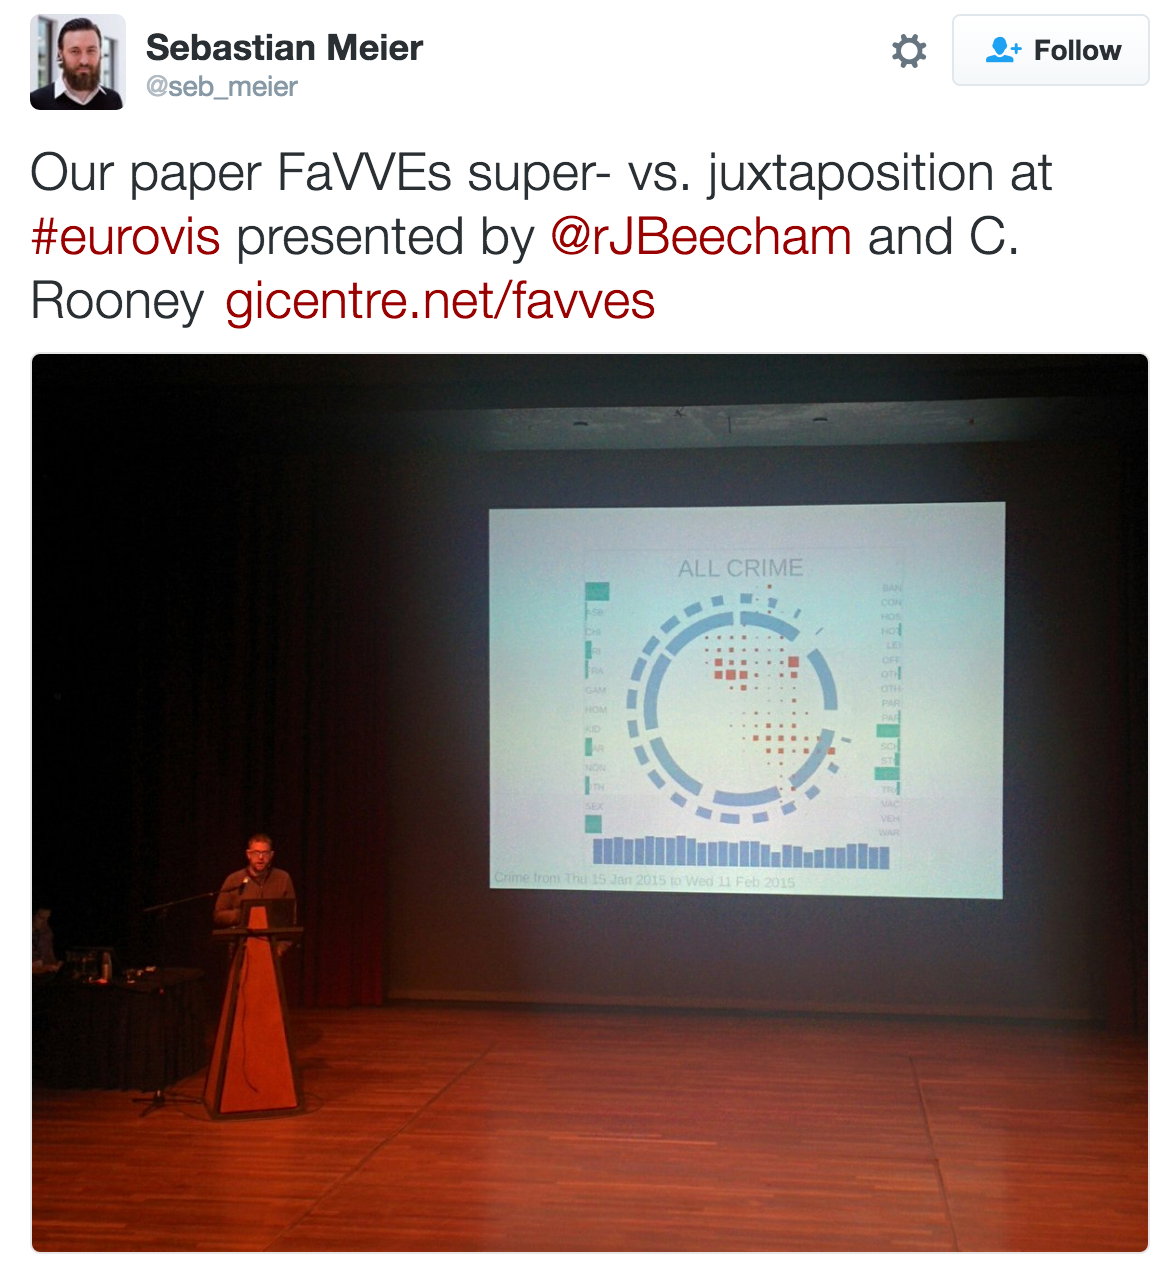
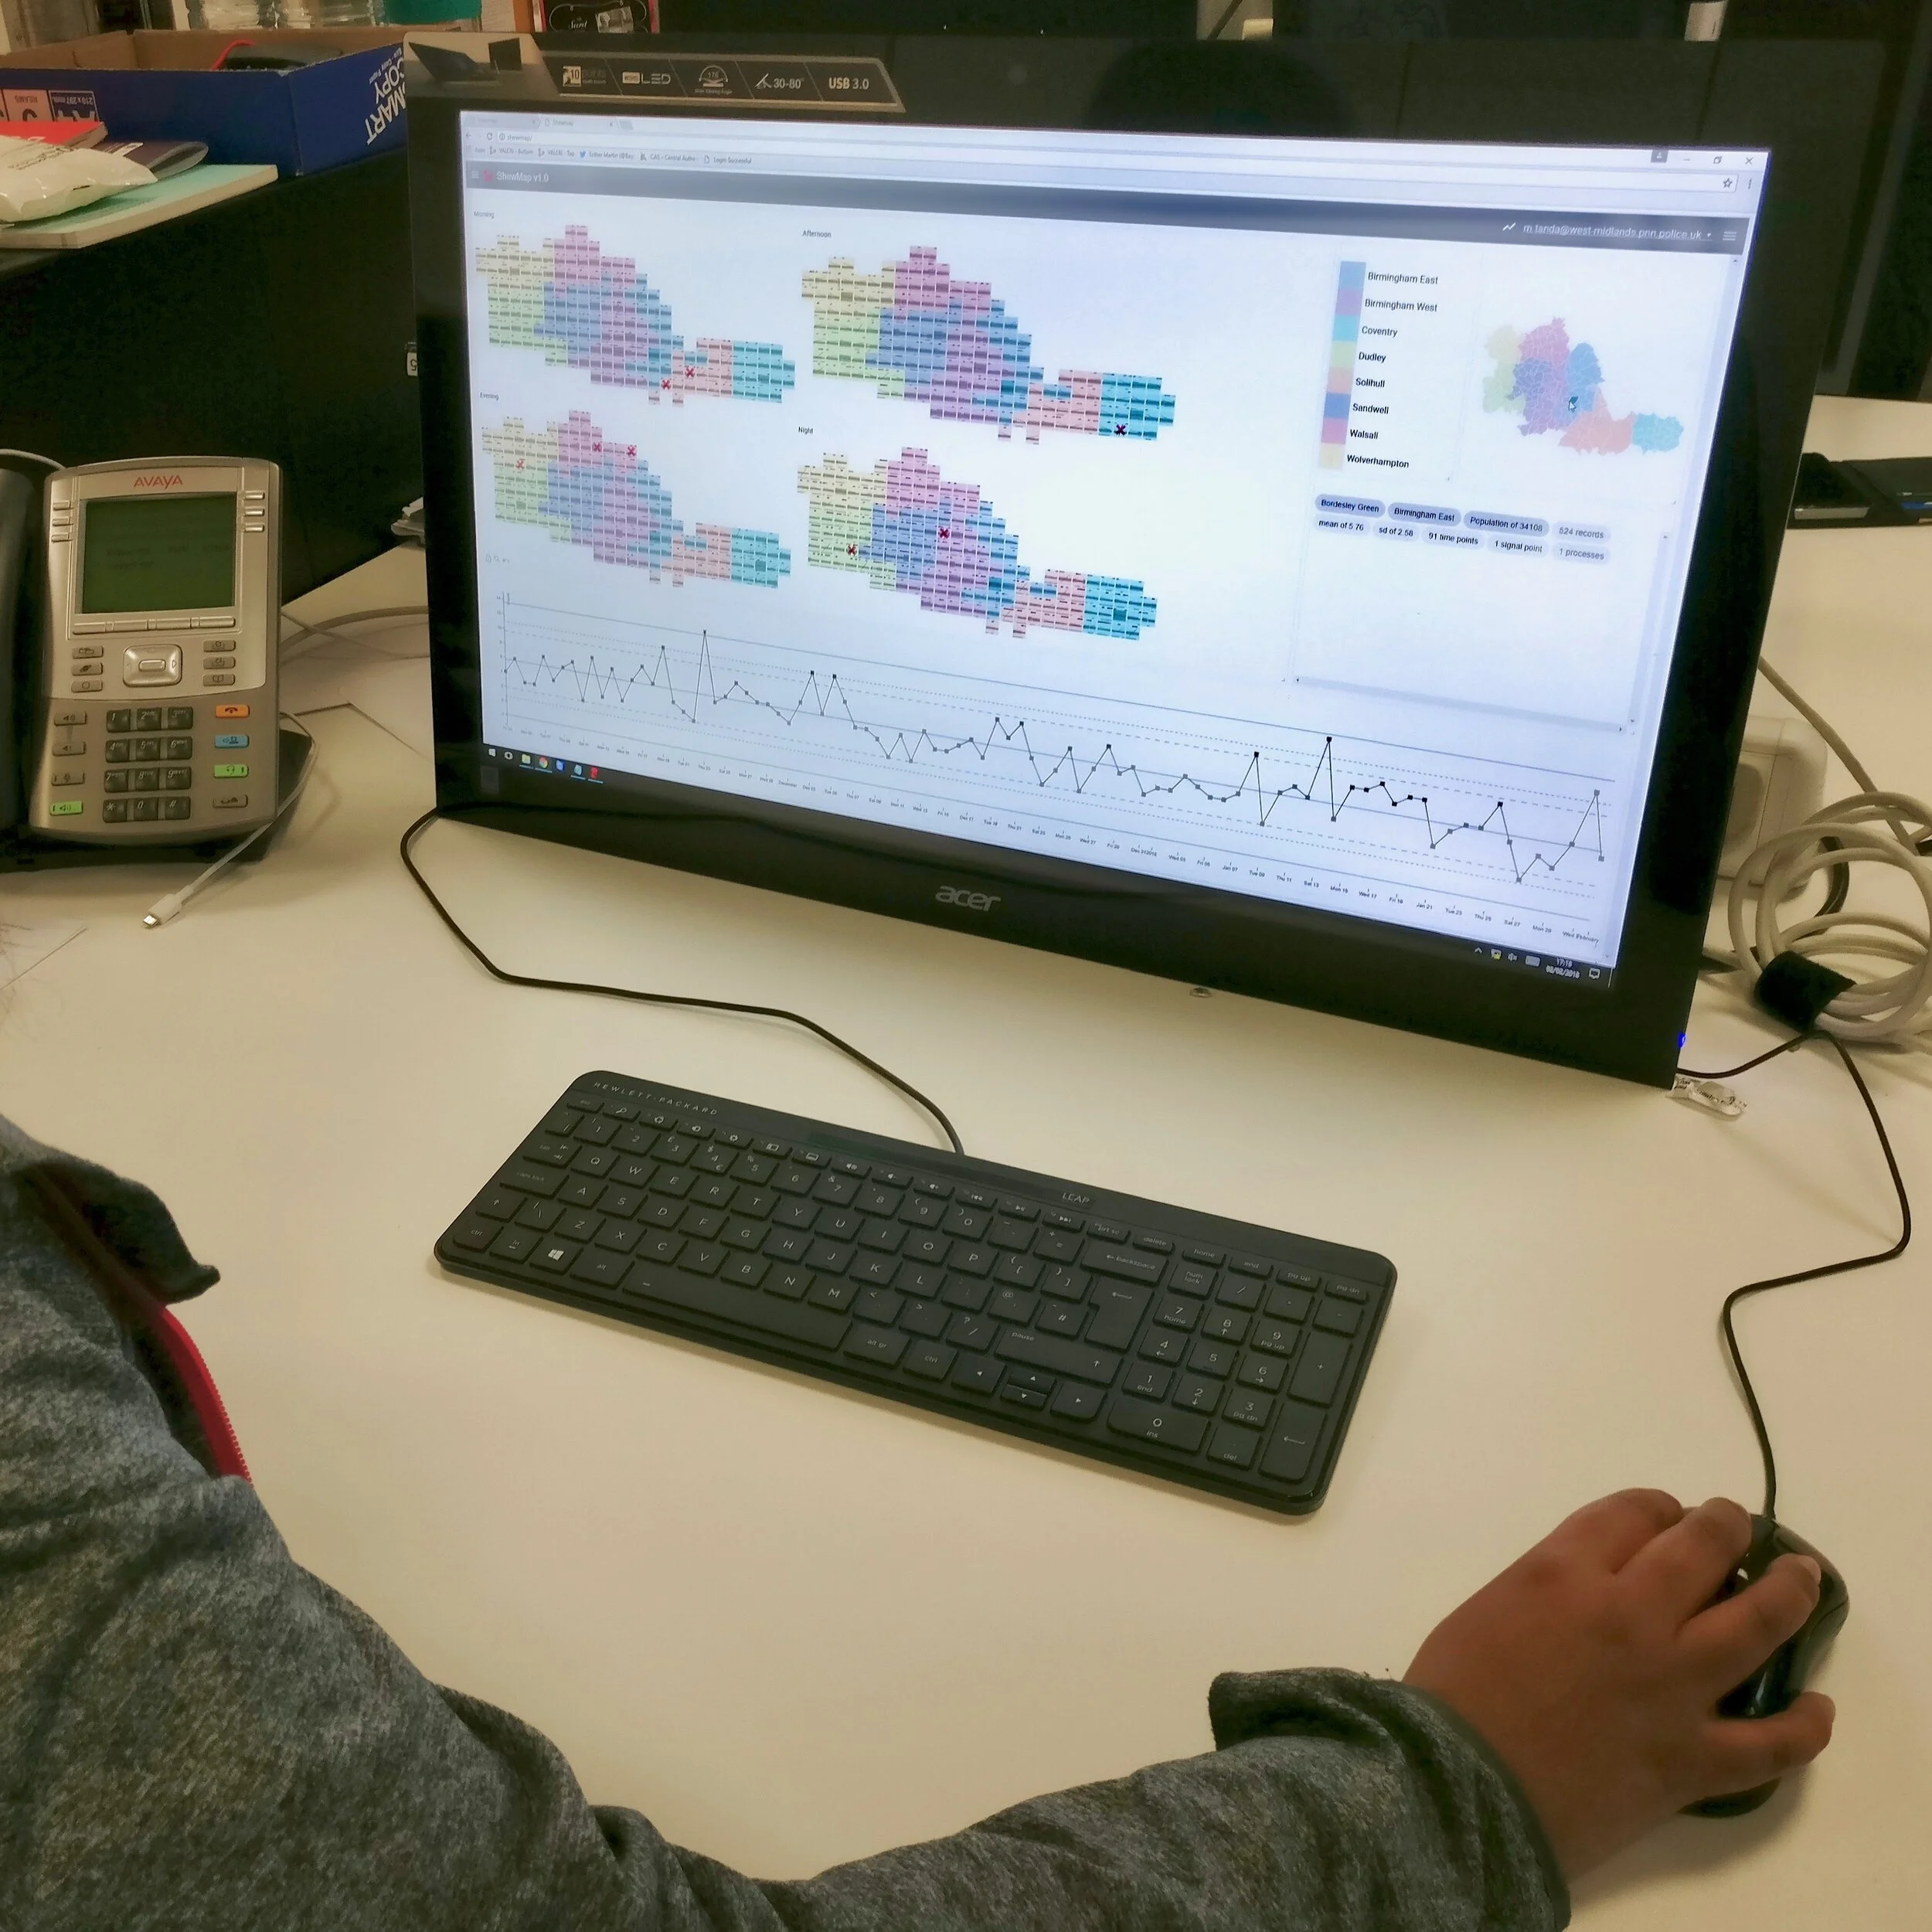
We make interactive pictures of complex structured data
that describe complex dynamic phenomena
Interacting with our pictures helps people make sense of their data and think analytically as they problem solve.
This kind of data visualization helps uncover patterns and relationships, inform decisions, engage stakeholders and communicate findings.
We think the this applies to a number of Green Deal topics - such as .
Wildfire Modelling
Citizen Engagement
Model Output Comparison
Scenario Comparison
Policy Communication
Examples - work from previous EU and other briefs and projects …
Doing this well requires judicious design, that is informed by current best practice and recent research about graphics, computers and how people use and interpret them.
We can provide this, along with methods for co-designing effective visualization tools and techniques.


